ggplot2热图,带有范围值的颜色
引用http://www.voidcn.com/article/p-gwnhvusn-bsz.html
set.seed(12345)
dat <-
data.frame(
Row = rep(x = LETTERS[1:5], times = 10)
, Col = rep(x = LETTERS[1:10], each = 5)
, Y = rnorm(n = 50, mean = 0, sd = 1)
)
library(ggplot2)
p <- ggplot(data = dat, aes(x = Row, y = Col)) +
geom_tile(aes(fill = Y), colour = "white") +
scale_fill_gradient(low = "white", high = "steelblue")
p
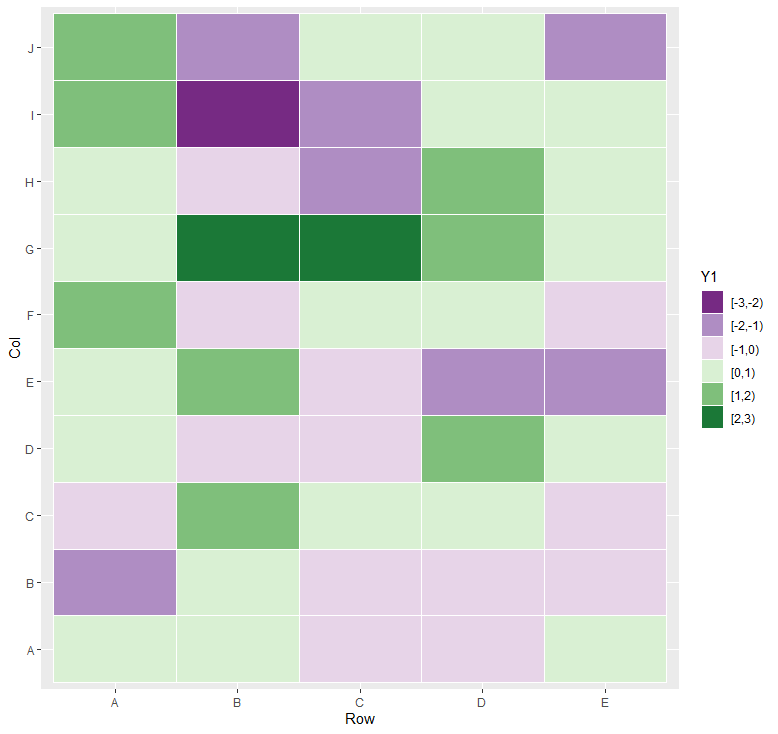
dat$Y1 <- cut(dat$Y,breaks = c(-Inf,-3:3,Inf),right = FALSE)
ggplot(data = dat, aes(x = Row, y = Col)) +
geom_tile(aes(fill = Y1), colour = "white") +
scale_fill_brewer(palette = "PRGn")