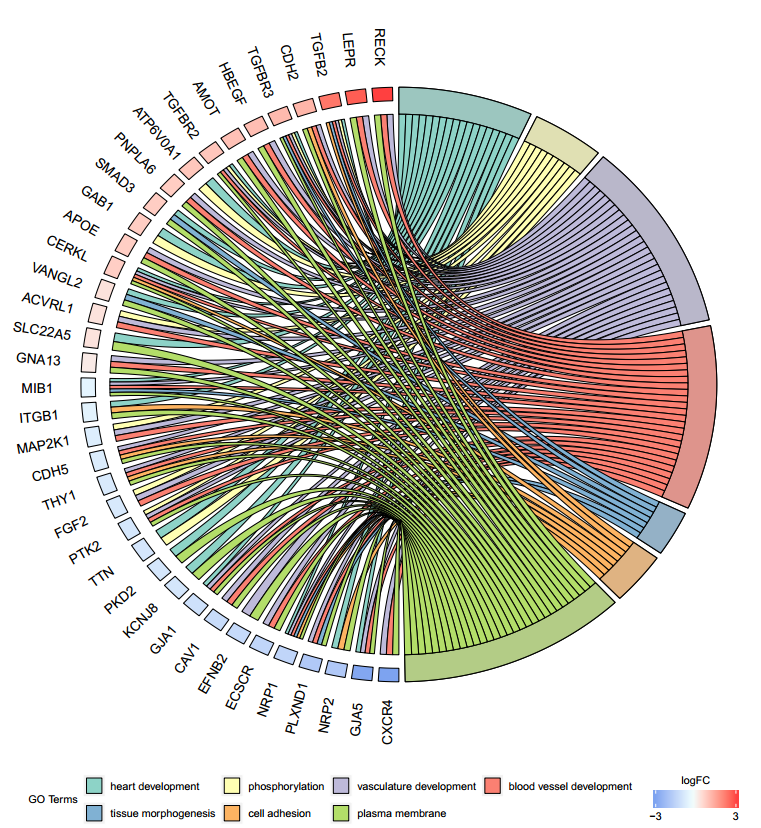
KEGG富集弦图
用GOplot包画漂亮的GOChord图和bubble图https://www.jianshu.com/p/9bda0ab65717
if (!requireNamespace("BiocManager", quietly = TRUE))
  install.packages("BiocManager")
BiocManager::install("GOplot",ask = F,update = F)


setwd("C:\\0Computer\\05G_Virtual\\KEGG弦图")
david <- read.delim("A_G_fat.vs.a_Z_fat.KEGG_Enrich.xls",sep = "\t",header = T)
genelist <- read.delim("A_G_fat.vs.a_Z_fat.diff_prot.xls",sep = "\t",header = T)
genes <- data.frame(genelist$ID,genelist$logFC)
genes
circ <- circle_dat(david, genelist)
hord <- chord_dat(data = circ, genes = genes, process = EC$process)
GOChord(chord, space = 0.02, gene.order = 'logFC', gene.space = 0.25, gene.size = 5)
library(GOplot)
pdf("wqqEprot1GO_4.pdf",height=30,width=32)
circ<-read.table("E_H.vs.C.diff_prot1_go.txt",header=T,sep='\t')
index <- duplicated(circ$genes)
data<-circ[!index,]
genes <- data.frame(data$genes,data$logFC)
chord <- chord_dat(data = circ, genes =genes,process=unique(circ$term))
GOChord(chord, space = 0, gene.order = 'logFC',gene.space = 0.25, process.label = 18.0, label_titlename='GO Pathways', gene.size = 10.0,border.size=0)
dev.off()
文件链接https://www.jianguoyun.com/p/DT_q6kwQoMLICRjhnfkD